radar_chart_plus 1.0.3  radar_chart_plus: ^1.0.3 copied to clipboard
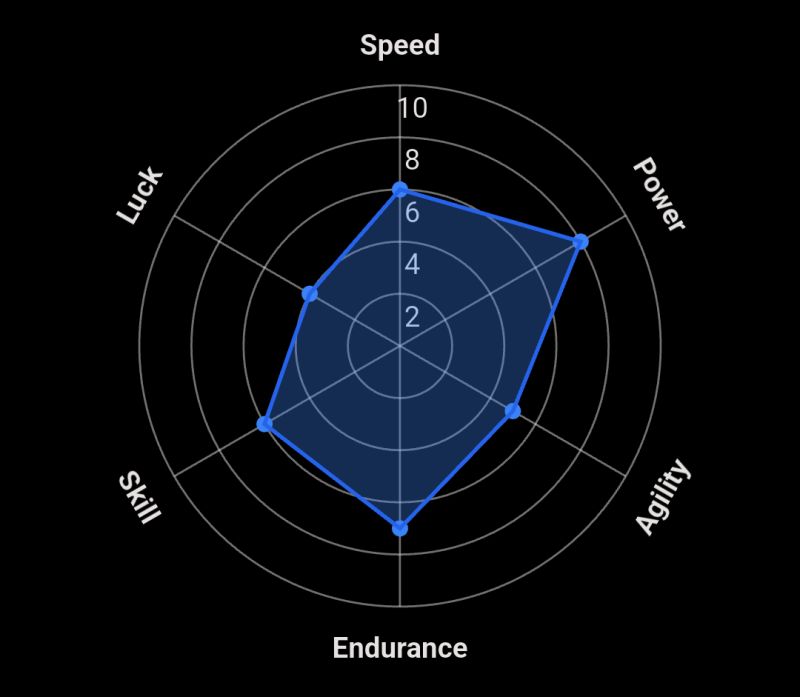
A versatile Flutter package for creating beautiful and customizable radar charts. Easily visualize multivariate data for comparisons and analysis.
radar_chart_plus #
A customizable radar (spider) chart widget for Flutter.
This package helps you visualize multi-dimensional data in a clean, interactive radar chart.
Features #
- 🎯 Draw radar (spider) charts with ease
- 🎨 Customizable chart colors, labels, and ticks
- 🔵 Optional dots at data points
- 📐 Responsive layout support
- ⚡ Lightweight and dependency-friendly
Getting started #
const like = 'radar_chart_plus';
Additional information #
This package was created to offer a modern, customizable, and lightweight radar chart widget for Flutter applications. Ideal for dashboards, analytics, and performance visualization. Feel free to contribute, report issues, or request new features on the GitHub repository.
Contribution #
Contributions are welcome! If you'd like to improve the package, follow these steps:
-
Fork the repository
-
Create a new branch for your feature or fix
-
Make your changes with clear commit messages
-
Submit a Pull Request describing what you changed and why
-
The PR will be reviewed and merged if everything looks good
Metadata
Publisher
Weekly Downloads
Metadata
A versatile Flutter package for creating beautiful and customizable radar charts. Easily visualize multivariate data for comparisons and analysis.
Homepage
Repository (GitHub)
View/report issues
Topics
#chart #visualization #radar-chart #graph #diagram
Documentation
License
![]() MIT (license)
MIT (license)